Originally published at Forbes.com on October 29, 2020.
It was going on two years ago, back in February of 2019, that Illinois Gov. J.B. Pritzker’s office announced the creation of two task forces to improve Illinois’ chronic pension underfunding. The first of these led to a report in October, that is, a year ago, proposing the consolidation of the asset management of Illinois’ police and fire pensions, which are managed by local municipalities rather than on a statewide basis, and very quickly thereafter, in November, to legislation accomplishing the proposal.
The second of these task forces, the Pension Asset Value and Transfer Taskforce, was intended, as described in the governor’s press release, “to analyze state assets across Illinois and make recommendations as to their best use to help stabilize the state’s finances. Recommendations could include, but are not limited to, the repurposing or sale of these assets or transfer to state pension systems to improve their levels of funding.” At the time, selling the Illinois Tollway was speculated to be a possibility, with the proceeds plowed into pension plans. Other observers speculated that the state could be playing financial games by transferring currently valued at “book value” into a fund where they’d be valued at “market value,” instantly conjuring up money!
And then . . . nothing.
Or, rather, nothing visible to the public.
According to (heavily-redacted) materials recently provided to me through a Freedom of Information Act request, the task force did indeed meet regularly in the months after its formation.
In April, the governor’s office claimed that their recommendations would be coming in July.
In May, reports were said to be coming “in the coming months,” with the expectation that the end result would be a “long-term pension reform plan.”
In September, the governor’s staff circulated among themselves a draft version of an Asset Transfer report. (I was unable to inspect the report itself.)
In October, that is, almost exactly a year ago, the office told an inquiring reporter that the task force was “still working on their recommendations and should be ready to present them soon.”
Finally, in November 2019, in response to a reporter, the staff said, “the chairs of the taskforce thought it would be helpful to have municipal representation at the table during discussions.”
And here the trail ends. There’s no explicable reason why a task force meant solely to identify whether the state could shore up the funding level of its public pensions via asset transfers, would involve city governments, especially when the Illinois Municipal Retirement Fund (all employees of Illinois cities except fire, police, and the city of Chicago) is nearly fully-funded. Had the scope of the task force been expanded to a point where local municipalities’ participation had truly seemed relevant? It was, after all, at about this time, again, a year ago, when Chicago’s Mayor Lightfoot had been calling for a “statewide pension reform package” — with, of course, no further specifics. Did this hypothetical broadened scope become unmanageable?
Were there indeed assets identified — but then squabbles about how any funds should be allocated? Or, what’s most likely, did they conclude that, other than the planned sale of the Thompson Center, the proceeds of which are unknown but earmarked for pensions, there’s just not a lot of extra cash to be scrounged up from the state’s metaphorical couch cushions? And, having concluded that, did they prefer to let the task force die a quiet death, eventually forgotten about, rather than issue a report which would disappoint its readers and embarrass those who promised solutions? It should be noted that I, likewise, asked the governor’s press office for an update but received no reply.
The bottom line is, of course, that, even prior to the arrival of COVID-19, there was no easy path towards states conjuring well-funded pension plans into existence without simply contributing the necessary funds to those plans.
December 2024 Author’s note: the terms of my affiliation with Forbes enable me to republish materials on other sites, so I am updating my personal website by duplicating a selected portion of my Forbes writing here.
Yesterday, the state of Illinois announced that suburban Cook County is now subject to covid mitigations, in which, as of tomorrow, indoor dining and bar service will be prohibited and groups at any one gathering will be capped at 25 people. As the Chicago Tribune reported,
By Wednesday, more than half of Illinois residents will be living under stricter measures meant to slow the latest surge of the coronavirus as suburban Cook County and the Metro East region outside St. Louis join four other regions where the state has shut down indoor dining and bar service and lowered the cap on crowds to 25.
A week ago, only one of the 11 regions in Gov. J.B. Pritzker’s reopening plan was subject to those rules. . . .
Suburban Cook County has had eight consecutive days of test positivity rate increases and seven days of increased hospital admissions. It is the first region to surpass the state-set thresholds for those two metrics at the same time. The other region have triggered tougher rules by reaching an 8% positivity rate threshold for three consecutive days. As of Friday, the rolling seven-day positivity rate for the Cook County suburbs was 7.7%.
With that context, I wanted to write down some of my recent thoughts on developments.
First, why did contact tracing fail?
Contact tracing was, after all, the subject of my May 15 Tribune commentary, in which I observed that the state’s reopening metrics required that for Phase 3, contact tracing would be fully-rolled out, and for Phase 4, contact tracing would be fully scaled up, so that tracing would begin within 24 hours for 90% of new diagnoses in a region. Turns out, Phase 3 began according to the timeline for all the other metrics, at the end of May, and Phase 4 began at the end of June. But according to the organization TestAndTrace, as reported at Patch, Illinois has a failing grade in their assessment of Illinois’ contact tracing, due to their very low number of tracers and lack of transparency about their progress.
With respect to Cook County, the Cook County Department of Health announced on June 11 the receipt of a $41 million grant to scale up contact tracing. But even just last week, Daily Line reporter Alex Nitkin had this to say:
Meanwhile, Cook County public health chief Dr. Kiran Joshi tells commissioners the county/city's joint contact tracing effort is deep in the recruiting process and expects "offers to go out in the next week or so."
Now, the question above is, I admit, partly rhetorical. I have my own suppositions as to why, when it really would have made a difference in the late spring/early summer, when cases were down and when Illinoisans were relatively more hunkered down — that is, when a contact tracing effort would have uncovered fewer contacts for any given individual — the state, and Cook County and the city of Chicago as well, fumbled this: the desire to create union jobs, for one, and the focus on “equity” even when a focus on “low-hanging fruit” might have been more effective. Various reports in the meantime have described the suspicion with which immigrants and low-income Chicagoans treat contact tracer outreach; focusing resources on parts of the state which would have a greater success rate, as well as more rural areas where there would have been fewer contacts to trace in the first place, would surely have found more success.
In any event, at this point, it is far less effective to contact-trace when cases are becoming increasingly prevalent, as is the case now.
And, in addition, it would appear that the state is misinterpreting the data that it does garner from contact tracing, in any case.
Earlier in the month, Capitol Fax provided a graph produced by the state which was used as justification for its focus on bars and restaurants. The graph is appallingly difficult to read (and is shown only as a picture, with no data accessible), but claims that, statewide, when contact tracees were asked where they had “visited or worked” within the past 14 days, the second-largest category of response was “restaurant/bar,” with 2300 responses. The top response was “other,” which includes “vacations, family gatherings, weddings, college parties.”
But this graph is exceedingly unhelpful. Respondents could give multiple answers, and the graph’s “n” is given as 17,939, but that’s the total number of boxes checked; a true “n” from such a survey would be the number of people surveyed. We don’t know what percent of tracees visited bars or restaurants, and, more importantly, we don’t know whether people who went to bars/restaurants were disproportionately likely to have been diagnosed with covid. In other words, to tell us something meaningful, this graph would need to be paired with another one, in which a random sampling of people who matched the demographic characteristics of covid-diagnosed tracing respondents.
And, in fact, here’s my transcript of Dr. Ngozi Ezike’s comments at the press briefing last Friday, upon being asked why bars and restaurants are being singled out for closure despite being linked to only 6% of outbreaks (about the 28 minute mark):
Ezike: An outbreak would be something if somebody works like say at a manufacturing plant and a lot of people work in close proximity and 50 people develop covid in that setting we would have that as a documented outbreak where this person knows that I was working next to this person, this person contracted the virus, a week later so did I, a week later this person did, three days later, so that is like a clearly documented outbreak. In most cases of covid, the person who has it cannot tell you exactly who they got it from, they cannot say, “oh, I was working in this setting and all these people got it and I got similar symptoms, so in the absence of a documented outbreak all those individuals that did contract the virus the way that you look at where they may have gotten it from is to look at the time at which, the time frame from when you catch the virus to when you show symptoms or to whey you’re diagnosed, in those preceding two weeks, we ask the cases, where have you been, and all of those places that they list, that they have been in the preceding two weeks are exposure sites. Any of those places could have been where they contracted the virus. And time after time, bars and restaurants come up as the number two or the number three place of all of these places frequented, so that’s why we put it as a high because it consistently comes up as a place where people who are infected listed as one of their exposure sites.
What’s remarkable is that Pritzker appears to recognized that this is a poor rationale for closing bars and restaurants, and he jumps in:
Pritzker: And I would just add that there are literally a dozen studies, many many articles about these bars and restaurants being exposure sites, and the effect of bars and restaurants on the spread of the virus and that is why there is a focus on bars and restaurants.
Ezike’s specialty is pediatrics and her expertise within public health comes from working on health care within juvenile detention centers. Is it possible that she just doesn’t have the grounding in statistics that’s necessary to grasp these concepts?
Second, why are hospitalizations level in suburban Cook County?
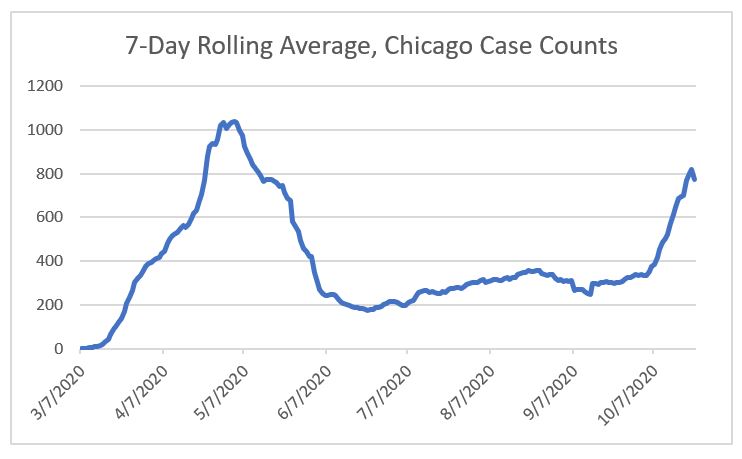
Wirepoints has been tracking key covid data for Illinois as a whole since early on. When cases rose starting in July, in a way that did not appear to be clearly linked to the ramping up of testing (because at that point the state had already increased testing substantially), I followed their tracking of hospitalizations and deaths and observed that these numbers were holding steady, in a manner that fit the theory that the rise in cases were due to increasing numbers of low-risk young adults becoming diagnosed, or that masks were having the effect of reducing the viral load and thus the severity of the infection.
But that’s no longer the case. On September 19, hospitalizations stood at 1,417. They rose gradually, to reach 1,575 on Oct. 3; since then they’ve risen steadily, to 2,605 on October 24.
What’s more, deaths have been increasing during the same time period. Ranging from the upper teens to the low 20s all summer and early fall, the 7 day average stood at 42 on Oct. 26. It’s also difficult to make a visual judgement, but there is no apparent lag, as you’d expect there should be, from the start of the increase in hospitalizations to the start of the increase in deaths; these are occurring simultaneously.
Frustratingly, it is not easy, from the information available at the Illinois Department of Health’s website, to look at hospitalizations by region or county. With a little bit of patience, we can look at admissions for Covid-like illnesses region-by-region:
Region 1, northwest Illinois: hospitalizations level over the summer, then steadily increase from 4 on September 20 to 14 on October 21.
Region 2, north-central-west: steady increase in hospitalizations over July (4 on July 3) to early August (12 on August 4), then another small increase in recent weeks (14 on Oct 22).
Region 3, central-west: again, small incease in mid-July, level to mid-October, then increase from 8 on Oct. 12 to 12 on Oct. 18.
Region 4, south- west (St. Louis area): relative peaks in late July and again in late August; decline since then to match the level of June.
Region 5, south: level/very gradual increase through September; then increase from 4 on Oct. 1 to 8 on Oct. 21.
Region 6, east: same pattern as south, very gradual increase through end of September, then jump: 8 on Oct. 2 to 19 on Oct. 22.
Region 7, far southern suburbs/exurbs: lots of bouncing around: peak in mid-August, decline, then increase from the beginning of October to now (6 to 16).
Region 8, western/far western suburbs: increase in mid-June, level through the end of September, then steep increase since then: 14 on Oct. 5 to 27 on Oct. 23.
Region 9, northeast Illinois (Lake and McHenry counties/far north suburban Chicago): increase in June, level through August, drop through mid-Sept. and level to the end of September, then increasing from 7 on Oct. 5, to 13 on Oct. 23.
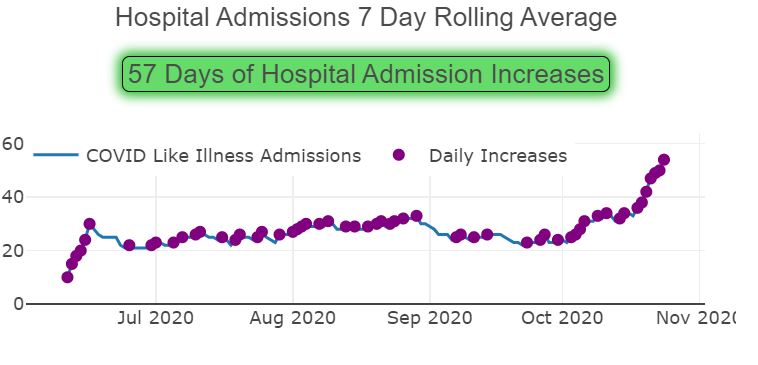
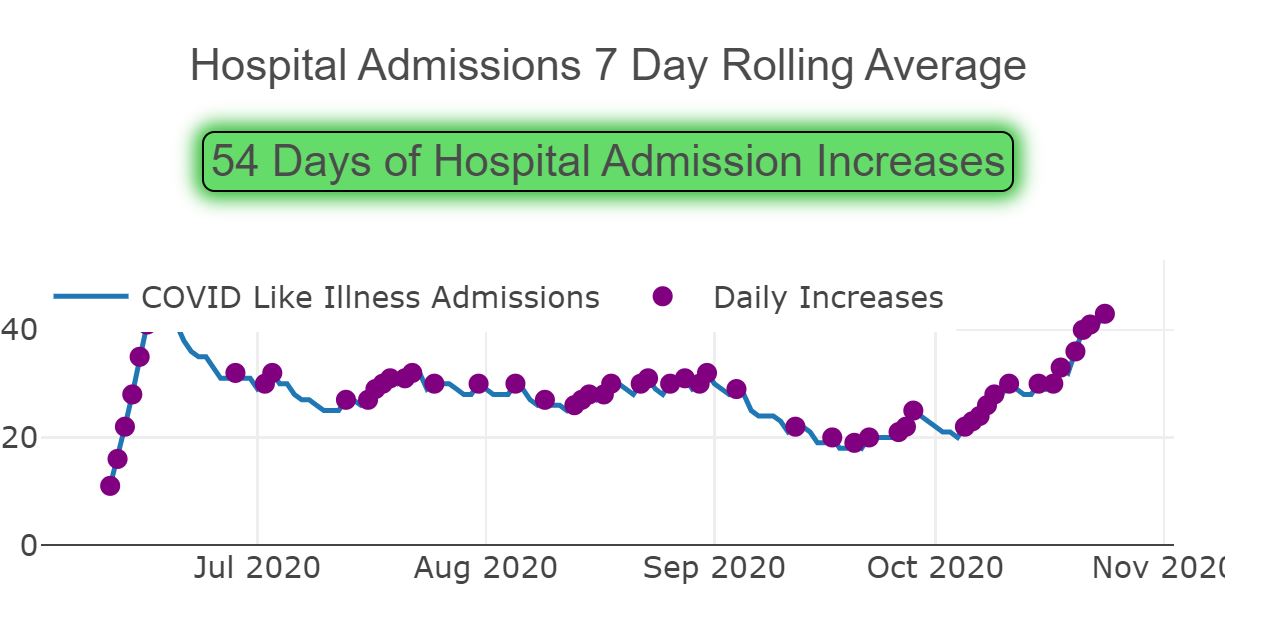
Region 10, suburban Cook County: level-ish through the end of August, a small drop through the end of September, then a jump from Oct. 2, at 23 to Oct, 22, at 49.
and Region 11, Chicago: level through July and August, drop in September to a low of 21 on Oct. 3, then up to 41 on Oct. 23.
(Note that the Wirepoints numbers are total hospitalizations; these are admissions on any given day.)
But, again, here’s suburban Cook County according to the IDPH dashboard:
Covid-like admissions, October 27 data. https://www.dph.illinois.gov/regionmetrics?regionID=10.
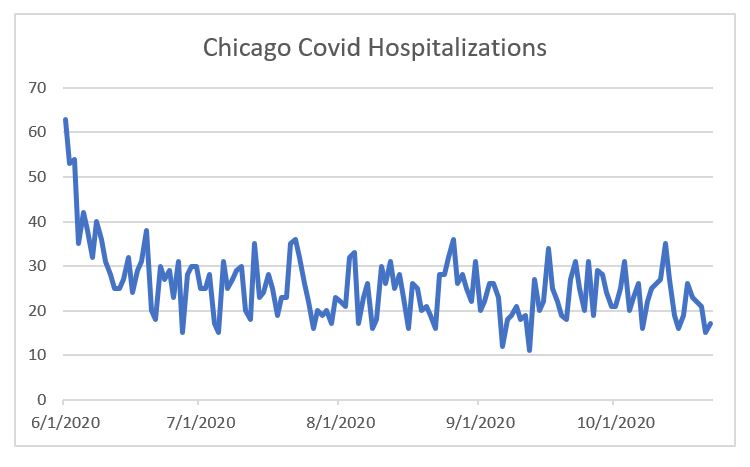
But at the same time, the Cook County Department of Public Health‘s own website’s reported hospitalizations have been level, showing no change other than a drop-off for the past week due presumably to lags in data reporting. (Note: as of today, they have removed the data on hospitalizations; I have requested an explanation.)
What’s going on? You’ll have to trust me that the CCDPH data was level, because it’s been removed, but is the fact that the state includes “covid-like illnesses” regardless of whether a patient has covid, causing an increase in the numbers? I can well understand using this broader definition back when testing was difficult, but covid tests are no routine for anyone who enters a hospital even for unrelated reasons.
Again, are hospitalizations due to covid really on the uptick? Or is it due to “covid-like illnesses”? Or — benefit of the doubt here — is there something faulty about the “covid hospitalizations” figure even after tests have become available without practical limits in terms of hospital access?
Third, what about Europe?
Biden, and Trump opponents generally speaking, are willing to say that a considerable number of America’s covid infections and deaths can be blamed on Trump’s poor management of the pandemic, and it’s easy to point to countries which have had extremely low infection rates — Japan, Taiwan, South Korea. It’s also easy to point to stunningly foolish things Trump has done and said, and the whole mask debacle, well, it’s been a debacle — insisting in March that masks were useless only to later on conclude they weren’t, but stoking substantial suspicion due to that prior insistence.
But claims that the US has been singularly incompetent in managing the pandemic are falling apart.
According to the Financial Times‘ website, measured on a cases-per-million basis, averaged over 7 days, the European Union’s rate equaled that of the US on October 11 or thereabouts. Now it’s rate is substantially higher, at 284.2 cases per million, compared to 200.7 in the US (as of Oct. 22 and 23, respectively). In fact, very few countries within Europe are lower than the US, and many of those which are, are seeing steady increases. Even Germany, lauded for its successful handling of the pandemic early on, is now seeing a surge in cases, with a 14 day change of 191% for new cases and 198% for deaths, compared to an increase of 40% and 14% for cases and deaths, respectively, for the US, according to the New York Times. (Remember, to increase by 191% is not to double, but to triple, that is, for the new case rate to be 3 times that of the original rate.) That means that seems quite likely indeed for Germany to reach our level of cases relative to the population by Election Day, which would be ironic when Joe Biden claims that he would have had German-levels of success in avoiding infections in the U.S.
Why are cases spiking in Europe?
Does that mean that there’s nothing, really, that can be done but hope that a vaccine and/or an antibody treatment is approved, manufactured, and distributed? What does an observation of the case increases in Europe mean for our decision-making about whether to shut down restaurants or merely restrict their capacity, or even to re-institute lockdowns?
This is where I end, as I don’t have answers to these questions, and I’ve achieved my short-term goal of writing now new information I’ve learned and issues I wanted to share.
If, back in 2008 when it was on the ballot, the call for an Illinois constitutional convention had passed, if we hadn’t been snookered by our betters who told us to vote no, if we Illinois voters had understood that the state constitution had fundamental flaws — including the pension clause, the provisions granting the House Speaker such substantial powers, the narrow definition of topics eligible for an amendment by means of petition-gathering, and more — then I’ll admit readily that I would have found it entirely acceptable to remove the clause forbidding graduated tax rates in the personal income tax as part of an overhaul. Why should that be in the constitution, rather than simply left for legislators to decide, based on the conditions any any given time?
But as it is, I cannot support the proposed amendment, because the elected officials who are and will be making decisions about tax rates have not left the world of corrupt and broken politics in which a graduated income tax is a recipe for failure.
A simple look at the new tax structure itself makes its flaws apparent. In the first place, there is a significant marriage penalty, as the tax brackets for the lowest four rates are the same for singles and couples. Bizarrely, it is only at the higher income levels that joint filers have a higher bracket level than single filers. What’s more, when a single taxpayer earns more than $750,000 or a couple earns more than $1,000,000, all of their income is taxed at the highest rate. In addition, the tax brackets are not adjusted for inflation or wage increases over time, so that over time, more and more Illinoisans will be subject to the higher rates. These three components of the new tax rates are completely out of line with the way the federal government, any state, or any sensible entity, taxes its residents. In fact, after the new legislation was proposed, I kept expecting these provisions to be revised, but that’s exactly how the bill was passed.
But beyond that, the advertising around the new amendment promises Illinoisans that they can have it all: all the state services they’re used to, improved education funding, property tax reductions, as well as a tax cut for themselves, paid for by the wealthy. This is corrosive to our civil society — and I’m not just speaking of the risk of businesses leaving the state due to the impact on small businesses filing as individuals as well as the corporate tax hike, but of the “us against them” mindset that the tax promotes.
The explanation on the ballot further misleads; as watchdog group Wirepoints observed, the ballot language misleads voters into believing that the constitutional change will only raise taxes of high, not middle-earner taxpayers. It falsely states that the method of taxing higher earners more is how “a majority of states do it” (in reality, it is more common for states to use their graduated tax rates to protect lower earners, while taxing middle- and high earners at the same rate). And it omits the change that removes a provision that there may be only one income tax, leaving open the possibility of adding a tax on retirement income by using a lower tax rate to make it more palatable, for example.
And at the same time, although thankfully we can keep adding to the tally of “years since a governor was sent to jail,” the state of Illinois and its elected officials have not truly committed to changing the way the state operates. Pritzker gives speeches professing “shared sacrifice” but in the end promises Illinoisans that they can have it all, paid for by increasing gambling, pot use, and taxes on the wealthy, and even still, despite massive budget holes facing the state, has made no cuts to payroll. A pension amendment is rejected out of hand. Ethics reforms stall. Madigan stays in power seemingly immune to scandals surrounding him, defended rather than being called to account by his party.
It is not sufficient merely to profess that Illinois is, or will be well-governed. To deserve its citizens’ trust and be given this new taxing power, the legislature must prove it has reformed. And it has failed to do so.
Originally published at Forbes.com on October 17, 2020.
Who are “WEIRD” people?
It’s a clever acronym, to denote people who are Western, Educated, Industrialized, Rich, and Democratic. But the acronym is meant to indicate something else as well, that psychologically, those of us whose ancestors hail from Western Europe, or who live in counties shaped by their culture, are weird, that is, different, in terms of our psychology, our norms, our sense of right and wrong, than the rest of the world. This is part of the thesis of a new book, The WEIRDest People in the World, by Joseph Henrich. The more remarkable part of that thesis, though, is something unexpected: that those differences have their origins in an unexpected source, the prohibition by the Catholic Church of marriages by people who were closely, or even distantly, related (as well as the requirement that the couple consent to the marriage and the prohibition of multiple spouses).
Now, readers may be wondering what this has to do with retirement — unless you’re a diligent enough follower of my writing to recall my April 2019 article about retirement in the Middle Ages. We may think that the notion of “retirement” is a modern one, and that as long ago as that, one worked until death or was simply cared for by one’s children, but that’s not true — even then, in Europe, newlyweds lived on their own, rather than staying in the family home to care for their parents as they aged. And that’s quite different than the “filial piety” of Confucian cultures or practices elsewhere (and, incidentally, the “Middle Ages” is a label that really only makes sense to use for Europe so that, as far as I’m concerned, “European Middle Ages” is redundant). Which means that Henrich’s theory provides insights that are helpful in thinking about retirement cross-culturally.
So let’s start with this: what are the psychological differences between WEIRD people and the rest of the world? Here are some of their traits: they (we) are “highly individualistic, self-obsessed, control-oriented, nonconformist, and analytical.” Henrich writes in his first chapter that
“We focus on ourselves — our attributes, accomplishments, and aspirations — over our relationships and social roles. We aim to be ‘ourselves’ across contexts and see inconsistencies in others as hypocrisy rather than flexibility. . . . [W]e are less willing to conform to others when this conflicts with our own beliefs, observations and preferences. We see ourselves as unique beings, not as nodes in a social network that stretches out through space and back in time. . . . When reasoning, WEIRD people tend to look for universal categories and rules with which to organize the world . . . . That is, we know a lot about individual trees but often miss the forest. WEIRD people are also particularly patient and often hardworking. Through potent self-regulation, we can defer gratification. . . . WEIRD people tend to stick to impartial rules or principles and can be quite trusting, honest, fair, and cooperative toward strangers or anonymous others. In fact, relative to most populations, we WEIRD people show relatively less favoritism toward our friends, families, co-ethnics, and local communities than other populations do. We think neoptism is wrong, and fetishize abstract principles over context, practicality, relationships, and expediency. Emotionally, WEIRD people are often racked with guilt, as they fail to live up to their culturally inspired, but largely self-imposed, standards and aspirations. In most non-WEIRD societies, shame — not guilt — dominates people’s lives.”
Henrich provides many examples of psychological studies (e.g., experiments conducted among university students globally, or by anthropologists in small villages) which show that WEIRD societies are the outliers in all these traits. One particularly striking one for me was the Passenger’s Dilemma: if you are in a car with a friend, and he gets into an accident, do you lie on his behalf to save him from legal consequences? Henrich shows the results in a graph rather than a table, but as it turns out, the footnote send me to a source with the numerical results, among which are that the the following percentages of people would refuse to lie, believing, that is, that universal norms of right and wrong are more important than the desire to protect our kith and kin:
Switzerland, 97%
USA, 93%
Canada, 93%
Ireland, 92%
Sweden, 92%
Australia, 91%
UK, 91%
Germany, 87%
Spain, 75%,
Japan, 68%,
Greece, 61%,
China, 47%,
Russia, 44%
South Korea, 37%.
What’s more, this particular book (Riding the Waves of Culture by Fons Trompenaars and Charles Hampden-Turner) focused on the importance of culture in global business and the questions were posed to individuals in business, which means that, one presumes people from non-WEIRD cultures would be more likely to be influenced by WEIRD norms (and, possibly, immigrants and minorities within WEIRD cultures themselves would be underrepresented in the survey group).
After establishing the distinctiveness of WEIRD culture, Henrich gives a lesson in the development of clans and states, and explains that, as people began to live in larger groups, clans developed, and, in most parts of the world, even when premodern states developed, intensive kin-based institutions remained important: extended households, arranged marriages with relatives (cousins), reliance on kin for protection and caregiving, and prevalence of polygynous marriages. This is still the norm in many parts of the world, and might have been the case in Europe, too, but for the “money wrench” of the Catholic Church’s regulations around marriage and family, what he calls the Marriage and Family Program, or the MFP. Beginning in late Antiquity, the Catholic Church promulgated prohibitions that increasingly expanded the restrictions placed on marriage, first to remarrying the sister of one’s deceased wife, then marriage between cousins or step-relatives, then second-cousins, second-cousins once-removed, third cousins, and eventually sixth cousins, before, in 1215, dialing back the prohibition to extend only to third cousins.
Why did the Church implement these prohibitions? The short answer is that the bishops and popes of the late Roman Empire and early Middle Ages considered them incestuous, but why? There’s no particular theological answer, and the prohibitions of the Eastern (Orthodox) Church(es) are much looser. Certainly, the overall discouragement of marriage benefitted the church directly, when people entered religious life and donated their land to the church (e.g., religious orders). Loosening the ties of kin and clan also strengthened people’s identity as “Christian.” What’s more, the shift from a third-cousin to a sixth-cousin prohibit was, to some extent, a fluke; Roman civil law counted each step up and back down a family tree as a “degree of consanguinity” but the medieval/Germanic method counted each step up alone (as we do today; our third-cousins have a shared great-great-grandfather), doubling the size of the family tree of prohibited relationships.*
This last bit fits in neatly with Henrich’s explanation that, from a cultural evolution perspective, in the same manner as in “regular” evolution, random mutations simply occur and enable to species to be more successful if they are useful, so, to, this was a mutation by chance which helped Christianity become more successful in spreading through formerly-pagan Europe, as the new norms of the MFP had its beneficial effects.
And, interestingly, these prohibitions, and their impacts, were not experienced Europe-wide. Southern Italy, in whole or part, was ruled by the Byzantine Empire during the early Middle Ages, and for a fair stretch Sicily was controlled by Arabs, as was, of course, Spain. And Sicily remains distinctive for its disproportionately high rate of cousin-marriage relative to the rest of Europe.
So how can you know that there is a connection between cousin-marriage, and high-intensity kinship institutions, in the first place? In the first place, Henrich compiles some truly remarkable graphs pairing Kinship Intensity Index (which looks at historical norms, from around the 1900s) and rates of cousin marriage even today with differences in psychological “norm” enforcement (more cousin-marriage, more community norms), individualism (more cousin-marriage, less individualism), trust of people outside one’s on group (more cousin marriage, less out-group trust), belief in universal ethical principles, such as the obligation to be honest at the expense of protecting kin or family (more cousin-marriage, less universalism), and so on.
He then traces the path that brought Western Europe from its early medieval “backwardness” (relative to the Byzantines and, later, the Islamic Golden Age) to the Industrial Revolution. Although the feudal system had lords, knights, dukes, kings, and the rest, the cities of the High Middle Ages were self-governing, with democratic institutions. Universities were likewise self-governing, as were the guilds for craftsmen (and women), and even monasteries voted on their Abbots, rather than this being a hereditary role. Merchant’s guilds enabled trade. Craftsmen took on apprentices from outside their family, and journeymen literally journeyed outside their hometowns, to further develop their skills — and all because, with clans and cousin- and arranged-marriage dismantled by the church’s prohibitions, new institutions arose to meet those needs instead, but in a way that enabled far more development, markets, even self-control and patience:
“Intensive kinship, through its strong normative obligations to a web of distant relatives, may create pressures that similarly disincentivize the cultivation of self-control or patience. I’ve seen this frequently in Fiji: an industrious person works hard to save money, but then some distant cousin-brother needs cash for a funeral, wedding, or medical procedure, so the nest egg evaporates. This makes sense because intensive kin-based institutions manage risk, retirement, and harmony collectively — through relationships — instead of via individual self-control and secure savings” (p. 377).
And, yes, Protestantism had the effect of intensifying the emerging WEIRD psychology, as well as emerging because in some respects it was a better fit for the new mindsets, with its emphasis on individuals relating to God directly rather than through institutions, and its promotion of individual literacy and Bible-reading. Finally, when it comes to the inventions that sparked the Industrial Revolution, they were the outcome of cities in which resources were available and knowledge was shared with a “collective brain.” Here, too, religious orders played a role: the Cistercians had monasteries which he labels “monastery-factories” all across Europe, and the abbots shared their knowledge with each other not just about theology but about “their best technical, industrial, and agricultural practices” in the medieval and early modern periods, and the monks then shared this knowledge with their local communities (p 446). But it was the teeming cities where innovation mushroomed — and, indeed, the number of people living in cities of over 10,000 increase 20 fold in the millennium from 800 to 1800, while at the same time, the number only doubled in the Islamic world and remained flat in China.
Finally, Henrich addresses the rapid development of Japan, South Korea, and China in modern times. How did this occur even though they weren’t WEIRD? In the first place, “these societies had all experienced long histories of agriculture and state-level governments that had fostered the evolution of cultural values, customs, and norms encouraging formal education, industriousness, and a willingness to defer gratification” (p. 476). Second, they each had top-down governments which, when they observed the development of Western countries, were able to copy many Western institutions in an “off the shelf” manner even if they hadn’t developed organically as the eventual result of the MFP.
So what ultimate conclusions do we draw from Henrich’s insights?
Looking at global retirement, one can easily enough connect Japan’s troubles, for examples, in transitioning from a norm where children take care of their elderly parents, to a social welfare state and/or expectations that one saves for one’s own retirement.
But is there a take-away for Americans? Could an understanding of WEIRD psychology provide insights into not just retirement in the past but what policy might be most successful in the future? That is, at the least, a question to ponder.
And one last note: do I recommend the book to readers? Depends on your patience — he takes 500 pages to make his case; the book is well-written and explains the issues well so you don’t need to be an Ivory Tower scholar to make sense of it, but, let’s face it, I’d still like to see a version for the more casual, less committed reader.
December 2024 Author’s note: the terms of my affiliation with Forbes enable me to republish materials on other sites, so I am updating my personal website by duplicating a selected portion of my Forbes writing here.